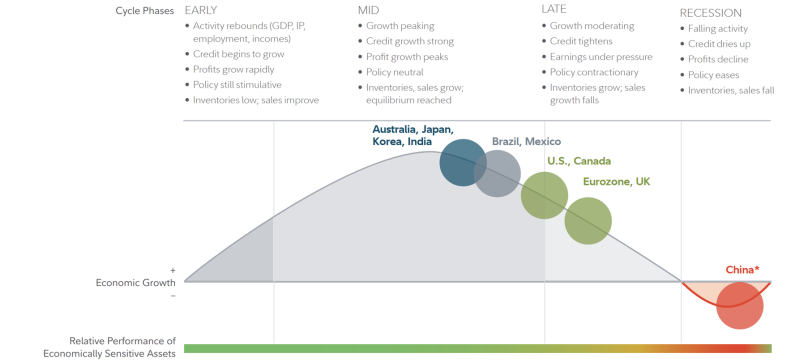


Market trends
Account Deletion Request
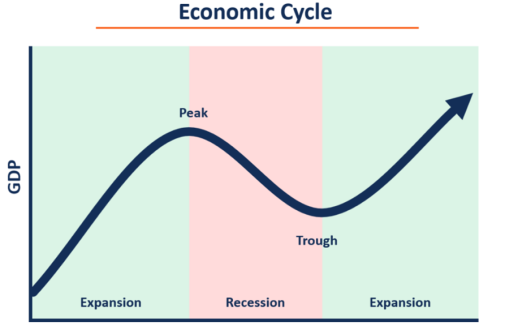
Your JonatanMars Account Deletion Process At JonatanMars, we respect your control over your personal data and provide a way for you to request the deletion ... The business cycle and macro indicators